Improving CRO Gross Margins with Project Margins
- Oct 31, 2016
- 8 min read
"Why is there a difference between between your study project margins and your overall business's gross margins?", is a question I got quite often during the sale processes for MDS Pharma Services, Omnicare Clinical Research and Theorem Clinical Research. Quite often, the follow up question is "How do your gross margins differ from those of the public CROs?". I want to use this article to answer the aforementioned questions and explain why it is important to understand your variable cost drivers when operating a CRO.
Net Revenue, Direct Costs and Gross Margin
For purposes our our discussion let's define revenue, direct costs and gross margin for CROs.
Net Revenue - The amount of money a clinical research business receives for services rendered. Examples of services are clinical monitoring, project management, data management, etc... Net revenue excludes pass-through revenues. Pass-through revenue are simply revenues that pass through the organization not associated with services provided by the CRO (investigator payments or monitoring travel costs are examples).
Direct Costs - Primarily labor and non labor project related costs. Below is an example of items included in 2015 direct costs for PRA, INC Research and Medpace per their SEC filings. Labor costs tend to make up a majority of these costs. For example, in 2015, 95.7% of PRA's direct costs were related to employee and staffing agency labor costs.

Gross Margin - Company profitability before taking selling, general and administrative costs in to consideration. Gross margin is calculated by subtracting direct costs from net revenue. Here are the 2015 gross margins for PRA, INC and Medpace:

Gross Margins in the clinical research industry tend to range between 40-50% (as evidenced by the chart above). In easier terms, a CRO tends to make $0.40-$0.50 on every dollar earned before paying for selling and administrative costs.
There is a pretty large spread between the direct costs % of PRA, INC and Medpace - there are various reasons this variability can occur. Keep in mind that this answer isn't in their public financial filings, I am giving some potential drivers based on personal experience. I'll discuss later how these drivers can be influenced.
Pricing - The price charged for services can have a dramatic effect. Below is an example assuming the labor cost to a CRO to perform a monitoring visit is $50. As you can see even a $5-$10 difference in price can have a substantial effect (gross margin ranging from 44.4% to 50%

Staff Utilization - I could write an entire article on utilization so I'll be succinct. A highly utilized employee is obviously far more profitable than an underutilized employee - an employee with low utilization could actually cause a business to lose money. Below is an example with all assumptions held constant except employee utilization (which translates into hours billed annually).

The example above shows that the difference between 80% and 50% utilization is the difference between making 37.5% and 0.0% gross margin. When you consider that the business still has to pay for selling, general and administrative costs, having a 50% utilization (in this example) will not only increase the direct cost as a % of revenue but also cause the business to lose money.
Reporting Differences - Companies have different costing philosophies which can impact direct cost as a % of revenue. An example I see quite often is the inclusion or exclusion of non-billable direct department management costs in direct costs. An example would be a Vice-President of Clinical Monitoring that isn't billable on projects but is responsible for the management of the overall clinical monitoring function.
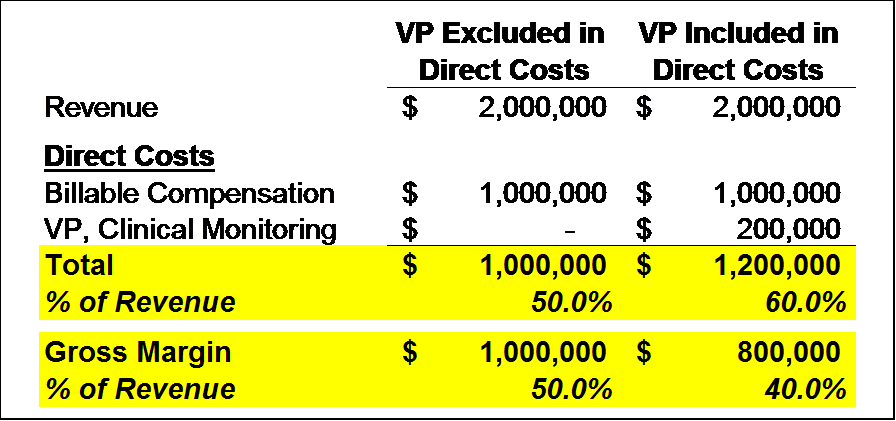
Obviously, a big gross margin difference 50% vs. 40%. Keep in mind that if the VP isn't accounted for in direct costs, they would be accounted for in selling, general and administrative expenses. The overall profitability would stay the same. This example just highlights how differing reporting philosophies can result in material differences when benchmarking gross margin %.
Miscellaneous Other Items - There are numerous other items that can drive gross margin % differences, here are a few:
Currency fluctuations
Labor cost rates driven by geographic location (for example a salary in Iowa may be less expensive than in California)
Different service mixes - Different services generate different margins - for example a lab business will be different than managing a clinical trial. Some CROs have multiple service lines making if difficult to do a true apples to apples comparison.
Project Margins
I think of project margins as a subset of gross margins. Project margin is sometimes referred to as variable margin and only includes billable costs directly attributable to managing a project. Aggregate project margin % is typically greater than a company's overall gross margin %. Basically only Billable Costs are included in a project margin calculation while billable and non billable direct costs are included in a gross margin calculation. The chart below provides examples of the types of expenses included in each calculation.

Below is an example of a project margin vs a gross margin calculation:

Several reasons why project margins (and the data accumulated to calculate project margins) are valuable:
Individual Project Performance
Understanding the financial performance of individuals trials can go a long way towards improving profitability. Large trials can really move the profitability needle at small and mid-size CROs. Below is an example of how the largest trial in the backlog can impact the consolidated project profitability at a CRO:

As you can see, Project #1, has the lowest study margin in the group at 30%. Because Project #1 represents almost 33% of total revenue (at $5M) it brings the entire portfolio down from 50% to 40.7% - a huge profitability swing. The reasons could vary from, the owner pricing the study low to get a high volume of work to just poor pricing or low utilization. Understanding the reasons for success and failure and addressing them are important to running a successful business in any industry.
Customer or Customer Category Performance
Let's take the individual study project margins a bit further. Aggregating study information by customer type (i.e. Large Pharma, Biotech, Medical Device, etc...) could provide insight on company performance within each customer type. Below is another example:

Total study margin % is 38%, however there is a large disparity in study margins between different customer types. Biotech customers are driving 47.1% margins, medical device 35.1% and large pharma 30.5%. Management would be wise to 1) understand the factors driving the difference, 2) focus on winning more biotech business, 3) determine whether large pharma and device margins can be increased.
Benchmarking vs Budget
I haven't seen a CRO yet that didn't have an elaborate bid grid. Bid grids include an incredible amount of company specific data and should really be considered proprietary tools for every CRO. Bid grids include service specific pricing, algorithms that determine how much time it takes to complete each service, the internal cost to complete each service and ultimately margins for each service and study put together in the tool. Expand that information for each service offered and each country where a CRO does business and you have a really complex tool filled with data that can be benchmarked.
I feel benchmarking actual study performance vs the study budget is a best practice (both financially and operationally - I am only addressing the financial side in this article).
Proposal budget margin vs actual study margin - Overall sanity check to see if actual margins are meeting budgeted expectations. Identifying subpar margins during the early stages of a study provide time will enable a CRO to "turn around" performance before its too late.
Proposal budgeted hours vs actual hours to complete - Checks to see if enough hours were budgeted or if efficiency is less than expected.
Average budgeted labor rate vs actual budgeted labor rate - Checks to see if actual average labor rate equals the budgeted labor rate. The use of external contract labor or higher priced internal positions can cause an unfavorable variance.
Services budgeted vs actual services completed - Helps identify change order opportunities (i.e. are more services being completed than initially agreed upon). I know change orders are always a controversial topic, but in order to avoid wasted efforts, CROs need to focus on contractually agreed upon services.
Improving Margins
Now that we have discussed in the detail the difference between study margins and company margins, let's consider a few ways both study and overall company margins can be improved.
Pricing - Pricing is where it all start's, price services too low and achieving acceptable margins can be close to impossible. A couple things to consider when determining price:
Understand the acceptable range of market prices - customers will not pay above the high end of the range and they may also get concerned at low end prices.
Understand the study profitability needed to achieve overall profitability goals - A simple formula shows the way: Study profitability - Nonbillable costs = Overall Profitability. Having a good understanding of these components will go a long way towards maximizing profitability.
Determine if you are a premium or a lost cost provider and price accordingly - Providing a premium service level but charging low cost provider pricing is a path to subpar financial performance. Do the opposite and you may not have many customers (pay premium prices for a low service level). Know your go to market strategy and price accordingly.
Utilization/Productivity - Remember our discussion above about staff utilization. A majority of CROs try to keep staff utilization in the 80-85% range. One caveat - utilization rates can be influenced by booking time to a trial that isn't billable. For example, taking 3 hours to complete a 1 hour task isn't productive but can artificially create a high utilization rate - that's why comparing actual hours spent to budgeted hours is important.
Using Appropriate Labor Costs - Two common occurrences that can erode margins:
External Labor - It's common for a CRO to use external labor when internal resources are limited. External labor is necessary but does come at a cost as it is usually more expensive than utilizing employees.
Incorrectly Utilizing Highly Compensated Internal Employees - Life in a CRO can get hectic and in order to get the work complete, it isn't uncommon to throw any available staff on the current task at hand. However, putting an internal employee making $80/hr on a task that pays $70/hr is an automatic loss. A strong operational management function will help move the chess pieces (i.e. staff) occordingly.
Project Management
I have always viewed the Project Manager as the study CEO. Project Managers are responsible for hitting timelines, staying on budget, solving problems and effective and timely communication to the client (to name a few). Having all of the metrics in the world can't replace a strong project manager. In fact, they really go hand in hand - a good project manager understands how to use operational and financial data to better manage their trial. You can't manage without a manager and you can't manage what you don't measure. Go ahead and hug your best project managers today (maybe check with Human Resources first!).
Wrapping Up
Unfortunately running a CRO isn't as simple as providing high customer service and getting paid. Understanding and influencing study profitability will go a long way towards maximizing a CRO's overall gross margin and company profitability. While it may appear to be a lot of data to track, once your internal processes are established, you will find that data informative and essential to long-term success. As always, I am interested in your feedback and would like to hear different ways of influencing CRO profitability.
Jason Monteleone is President at Pivotal Financial Consulting, LLC. A Strategic Financial Consulting Firm serving the Clinical Research Industry. Jason can be reached at jmpivotalfinancial@gmail.com.
Comments